Saturday, June 22, 2013

Consumers Watched Nearly 41 Billion Online Videos in May

comScore Video Metrix service shows 182 million Americans watched nearly 41 billion online content videos in May, while the number of video ad views reached 15.8 billion.

Top 10 Video Content Properties by Unique Viewers
Google Sites, driven primarily by video viewing at YouTube.com, ranked as the top online video content property in May with 154.5 million unique viewers, followed by Facebook with 60.4 million, AOL, Inc. with 53.8 million, VEVO with 52 million and NDN with 46.5 million. Nearly 41 billion video content views occurred during the month, with Google Sites generating the highest number at nearly 14 billion, followed by AOL, Inc. with 839 million. Google Sites had the highest average engagement among the top ten properties.

Top U.S. Online Video Content Properties Ranked by Unique Video Viewers
May 2013 Total U.S. – Home and Work Locations
Content Videos Only (Ad Videos Not Included)
Property Total Unique Viewers (000) Videos (000)* Minutes per Viewer
Total Internet : Total Audience  182,217 40,953,776 1,247.9
Google Sites 154,537 13,958,260 436.7
Facebook 60,429 727,383 26.1
AOL, Inc. 53,845 838,934 64.2
VEVO 52,024 591,209 37.9
NDN 46,457 505,339 78.5
Microsoft Sites 45,179 541,503 36.9
Viacom Digital 43,676 415,654 41.2
Yahoo! Sites 43,625 342,432 72.7
Amazon Sites 33,740 163,817 17.8
Turner Digital 32,975 276,951 41.7
*A video is defined as any streamed segment of audiovisual content, including both progressive downloads and live streams. For long-form, segmented content, (e.g. television episodes with ad pods in the middle) each segment of the content is counted as a distinct video stream.Video views are inclusive of both user-initiated and auto-played videos that are viewed for longer than 3 seconds.
Top 10 Video Ad Properties by Video Ads Viewed
Americans viewed 15.8 billion video ads in May, with BrightRoll Platform ranking #1 with 2.6 billion ad impressions. Google Sites came in second with nearly 2.6 billion ads, followed by LiveRail.com with 2.1 billion, Adap.tv with 2.1 billion, Hulu with 1.7 billion, Specific Media with 1.4 billion and TubeMogul Video Ad Platform with 1.2 billion. Time spent watching video ads totaled 6 billion minutes, with BrightRoll Platform delivering the highest duration of video ads at 1.3 billion minutes. Video ads reached 53 percent of the total U.S. population an average of 96 times during the month. Hulu delivered the highest frequency of video ads to its viewers with an average of 71.

Top U.S. Online Video Ad Properties Ranked by Video Ads* Viewed May 2013
Total U.S. – Home and Work Locations
Ad Videos Only (Content Videos Not Included)
Property Video Ads (000) Total Ad Minutes (MM) Frequency (Ads per Viewer) % Reach Total U.S. Population
Total Internet : Total Audience  15,844,581 6,042 96.5 53.1
BrightRoll Platform** 2,624,509 1,340 16.2 52.5
Google Sites 2,553,208 233 23.7 34.9
LiveRail.com† 2,128,167 742 23.9 28.9
Adap.tv† 2,098,981 1,000 15.8 43.1
Hulu 1,666,610 653 71.3 7.6
Specific Media** 1,411,102 552 12.5 36.5
TubeMogul Video Ad Platform† 1,225,897 349 13.5 29.4
Tremor Video** 882,522 459 11.6 24.5
Videology† 632,899 262 8.1 25.1
AOL, Inc. 630,551 296 12.1 16.9
*Video ads include streaming-video advertising only and do not include other types of video monetization, such as overlays, branded players, matching banner ads, etc.
**Indicates video ad network
†Indicates video ad exchange/DSP/SSP
Top 10 YouTube Partner Channels by Unique Viewers
The May 2013 YouTube partner data revealed that video music channel VEVO maintained the top position in the ranking with 50.2 million viewers. Fullscreen held on to the #2 position with 36.5 million viewers, followed by Maker Studios Inc. with 32.4 million, Warner Music with 32 million and ZEFR (formerly MovieClips) with 27.5 million. Among the top 10 YouTube partners, Machinima demonstrated the highest engagement (63 minutes per viewer), followed by Maker Studios Inc. (48 minutes per viewer). VEVO streamed the greatest number of videos (562 million), followed by Maker Studios Inc. (433 million).

Top YouTube Partner Channels* Ranked by Unique Video Viewers May 2013
Total U.S. – Home and Work Locations
Content Videos Only (Ad Videos Not Included)
Property Total Unique Viewers (000) Videos (000) Minutes per Viewer
VEVO @ YouTube 50,238 561,631 36.1
Fullscreen @ YouTube 36,486 284,829 23.8
Maker Studios Inc. @ YouTube 32,371 432,854 47.5
Warner Music @ Youtube 31,956 176,509 17.7
ZEFR @ YouTube 27,497 130,772 13.5
The Orchard @ YouTube 24,313 90,023 10.4
Machinima @ YouTube 21,371 349,628 62.6
UMG @ YouTube 19,838 68,297 9.9
BroadbandTV @ YouTube 16,451 112,491 21.6
SonyBMG @ YouTube 16,250 44,173 8.3

Other notable findings from May 2013 include:
  • 84.8 percent of the U.S. Internet audience viewed online video.
  • The duration of the average online content video was 5.6 minutes, while the average online video ad was 0.4 minutes.
  • Video ads accounted for 27.9 percent of all videos viewed and 2.6 percent of all minutes spent viewing video online.

No Time? No Resources? Not sure where to start?
Call Jeff at 888-712-8211 today!  


VMakers - Video simplified.
Trusted by Disney, Warner Bros, NBC, Paramount, CBS and ABC.
info@VMakers.com

Wednesday, June 19, 2013

One in Ten Videos Are Played on Mobile/Tablets [study]


Ooyala released its Q1 Video Index this week, with more stunning statistics not only about the growth of video online viewing but particularly about the fact that viewing is happening ever more so on tablets and smartphones.

In some places around the world an even bigger trend might be the amount of live video streaming that is happening on devices.

Let’s start with this: The share of tablet and mobile video grew 19% in just the first Q1 2013. Mobile and tablet video now account for more than 10% of all online video plays, the Ooyala study says. In the first quarter, last year, that figure was just 4%.

And here’s another creeping-up-on-you-stat:  Mobile and tablet viewers spend more than half their viewing time watching long form videos, which in this case means ten minutes or longer. Still one quarter of the time spent watching on tablets was for content that was an hour or more long.  Pretty clearly, worldwide, that tablet might as well be a TV and movie screen.  

Globally, desktop viewers watched live news, sports and special events for an average of 40 minutes per play.  On average, people streamed live video on smart TVs and gaming consoles for 45 minutes per play last quarter.

That’s nine times longer than VOD. Desktop viewers watched live video 13 times longer than VOD last quarter, tablet video viewers watched live video four times longer, and mobile audiences tuned in to live video three times longer.

Ooyala paid special attention to Pacific Rim nations for this edition of the study, because there, patterns are emerging faster, or just differently, than other places. In some places, including Singapore, Hong Kong, Japan and Korea, viewers watch live video 20 times longer than on-demand video, across all device types. That’s far longer than in other places around the world, where the ratio is still a mind-boggling 12 to 1, using all devices.

Other quirks: Long -form video viewing made up 45% of the total time spent with online viewing in Malaysia. And in Singapore, live viewing averages 52 minutes per session, more than anywhere else in the region.

Ooyala measures viewing habits of nearly 200 million unique viewers in 130 countries every month, so this is the view of the online video world pretty much from outer space. Still it provides a rather impressive view of the online world right now, which is changing and growing rapidly.

For the first time in the first quarter just ended, Ooyala said, that mobile (53%) and tablets (52%) beat desktop PCs (38%) in percentage of time spent watching long-form video.

 “Cross-device measurement is critical for content owners and broadcasters as they move their premium content online” said Sudhir Kaushik, director of products, insights and optimization at Ooyala,  in a press release that accompanies the study. “Our ability to collect content and advertising data from each viewer on any device at any time and then process that information into insights in real-time is what differentiates us.”-Mediapost

Take Your Video To The Next Level.
Call Jeff at 888-712-8211 today!  

VMakers - Video simplified.
Trusted by Disney, Warner Bros, NBC, Paramount, CBS and ABC.
info@VMakers.com

Monday, June 17, 2013

Ready For The Dual-Screen Future?

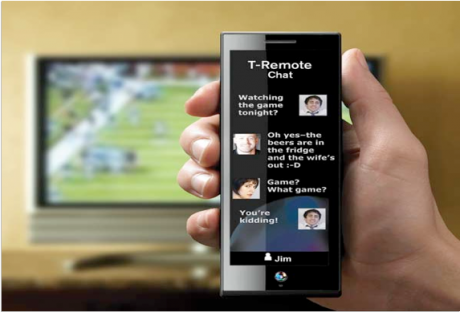
Multi-Screen Experiences - Television and Smartphone

Dual-screen experiences are about to transform the way people interact with video and the way publishers, broadcasters and advertisers capture and engage their attention. We’ll see handheld devices and big-screen TVs working together to create exciting possibilities for entertainment, game play, social interaction, marketing, and commerce.

According to Nielsen, more than 39% of Americans use their smartphone while watching TV at least once each day, and 62% do so multiple times each week.

Are advertisers ready to capitalize on the revenue potential that dual screen will bring?

For marketers, dual-screen advertising opens the door to creative that is more intriguing for viewers, as well as more effective in driving specific types of conversions. For example:
  • A national auto ad runs on the TV screen while the handheld device simultaneously shows a geo-targeted companion ad with local dealer information and a build-your-own-car app.
  • A TV ad for the latest blockbuster franchise movie presents an interactive quiz on earlier films in the series. Viewers use their tablets to respond, viewing crowd-based results in real time.
  • Instantaneous cohort-based surveys delivered through the handheld gauge the effectiveness of a consumer packaged goods brand’s TV ad, rewarding participants with special offers.

For publishers and broadcasters, experiences like these add freshness and interactivity to their properties. They can boost TV ratings and ad revenue, as viewers that might have defected to online and mobile video return to take advantage of the new dual-screen experiences.

The greatest technical challenge will be the definition of standards. Industry leaders are already working on standards for broader compatibility across platforms, so expect dual screen apps to become more popular over the next 12 to 24 months.

Another key element is the ability to sync content between the TV and handheld. One approach is through audio fingerprinting: the microphone on the handheld listens to the TV to identify the content and its timing.

This can work, but doesn’t serve as a long-term solution. A more robust model will deliver information to a handheld app about the TV content available, use viewer data and input from the handheld to drive targeting and content selection, and serve the corresponding video and other content back to the TV seamlessly.

Advertising technology, digital video and rich media ad creative, and IAB ad standards continue to be based entirely on a single-screen metaphor. As programmers and multiservice operators look to monetize the full real-estate inventory afforded by dual-screen viewing, a new standard is necessary to help accelerate adoption of new formats. While experimentation has a valuable role to play, it’s incumbent on groups like the IAB to see that standards do emerge to prevent ongoing splintering of formats, sizes, and server technologies.

For dual-screen advertising to pay off, it needs to reach a critical mass of consumers, which will be challenging early on. Until dual-screen experiences become the norm, we’ll be dependent on a small but growing number of innovators to go first, do the work to deliver these experiences, and prove their effectiveness and ROI to the industry.

The dual-screen future is an exciting prospect, but be ready for the opportunities it presents. Think about what it’ll mean for your business in terms of content, process, and technology. More interactive and engaging ads will drive better results for the brand and publisher alike.-MediaPost

No time? No resources? Not sure where to start?
Call Jeff at 888-712-8211 today!  

VMakers - Video simplified.
Trusted by Disney, Warner Bros, NBC, Paramount, CBS and ABC.
info@VMakers.com

How Visual Storytelling Connects with Consumers Around The World [infographic]


-Edelman

No time? No resources? Not sure where to start?

Call Jeff at 888-712-8211 today!  

VMakers - Video simplified.
Trusted by Disney, Warner Bros, NBC, Paramount, CBS and ABC.
info@VMakers.com


Friday, June 14, 2013

8 Mobile Video Myths

Even the most cautious of mobile projections can't downplay the incredible growth in mobile video consumption, and the ad dollars that follow. By 2017, eMarketer predicts that mobile video ad spend will hit $2.7 billion, or nearly 30% of total digital video ad spend.

But as in any case where the space grows at a breakneck pace, there is a deep information gap about capabilities, limitations and even definitions. Below are some common misconceptions we often hear around mobile video – and the actual truth.

Myth #1: The screen is smaller, so my ad will have less impact
Have you ever seen someone super-engaged as they play a sophisticated, high-resolution video game on their smartphone? Or on a train, using their commute to enjoy "Game of Thrones" on Netflix? Those little screens pack a lot of pixels, and video looks great on them.

Mobile video advertisers can capture consumers’ attention at all times of the day, not just while they’re at their desk at work or at home watching TV. And compared to online, mobile is far less cluttered -- no “banner blindness” means more space for brand recall. In fact, mobile video campaigns have been found to lead a 19X increase in aided awareness, a 4X increase in unaided awareness and a 2X increase in ad awareness, according to InsightExpress. Still don't think your ads will have impact? Think again.

Myth #2: No one is going to watch my video ad all the way though
Nearly half (47.8%) watch mobile video ads to the end, according to Celtra's April report. They also found that having a video option encouraged engagement with an ad; about 14% of viewers interacted with an ad by playing a video.

Myth #3: It's pre-roll or nothing
Pre-rolls do get significantly more impressions, but don't discount the rest. According to this Adobe study, ads placed at the end of a video have a better click-through rate (about 3%) than those placed within it or on the front end. Mid-roll ads have the highest completion rates, while post-rolls work best for direct-response advertisers with a call to action.

Myth #4: Calls to action all "click out" and require a mobile landing page
Not so. You can have activity within the video unit itself. On premium branded mobile video ad units, you'll find overlays that can engage users via swipe, shake, or other mobile-only actions that open up a branded slate that can house multiple videos, product information, and more.

Myth #5: All mobile video is clickable
Even by the end of 2012, when mobile ad technology had already come so far, that functionality was not as widely available as you might imagine, especially if the video played directly in the "native player" of the mobile device.

This year we’ve seen a burst of clickable, interactive elements for mobile video. These clicks don’t just lead the user out to a mobile landing page -- they can be customizable to include other types of calls to action. And since they’re non-linear, you can use text, graphic ads, or video overlays to display a message on top of the video content itself.

Myth #6: Video consumption is mainly taking place on tablets
Smartphones account for 90% of time spent watching mobile video, with only the remaining 10% of time spent watching video on tablets, per Flurry study. This is especially significant given that smartphones only account for 79% of active users.

Myth #7: Mobile video isn't scalable
Billions of transparent, premium and brand-safe mobile video impressions are available. It’s so scalable, in fact, that advertisers can layer contextual and demographic targeting on top of it.

Myth #8: You can't really measure the impact of mobile video ads
Of course you can. You can measure clicks and completion rates in quartiles, and also run brand studies and ad effectiveness studies in conjunction with a mobile video campaign to measure its effectiveness. In addition, some ad platforms allow advertiser add survey-based research to measure the impact of their mobile ad video campaigns, which can provide validation that it is positively affecting their brand metrics.

Mobile video advertising is not only here to stay, it's only going to get better as the industry matures. And if the past year is any indication, that innovation will happen extremely fast -- bringing new levels of targeting, transparency, and more efficient ad serving for video ads. Add this to the already personal nature of mobile devices and the inherent opportunity within the video medium for brands to tell stories that attract, engage and emotionally involve their viewers, and we're looking at an enormous opportunity.-MediaPost

No time? No resources? Not sure where to start?
Call Jeff at 888-712-8211 today!  

VMakers - Video simplified.
Trusted by Disney, Warner Bros, NBC, Paramount, CBS and ABC.
info@VMakers.com

Wednesday, June 12, 2013

Social Video Significantly Increases Brand Attention


Recent research from the Unruly Social Video Lab has found there is a huge appetite for branded videos on the web. Unruly currently tracks 506,976 "shares" of online video ads every 24 hours.

This morning, Unruly opens its doors on its first Social Video Lab in America, enabling advertisers to make the most of this trend. Located in New York, the new lab is modeled on the video technology company's original Social Video Lab in London, which was launched last summer.

Visitors to the New York lab will be given a hands-on interactive journey through the science and history of online video sharing, plus a tour of current video trends. They will also have access to the Unruly Viral Video Chart, which has tracked 329 billion video streams since 2006. Advertisers can find out how their current social video footprint compares with their competitors, how to create shareable content, and how to determine the distribution strategy required to achieve their campaign goals.

Visitors will also be able to test the shareability of their own campaigns using Unruly ShareRank, an algorithm-based tool which uses over 100,000 data points to predict the number of shares a video will attract, before it is even launched, meeting the seemingly impossible desire to "predict viral success."
During a tour of the new lab last week, Cat Jones, Unruly's Director of Product Innovation, said, "Video is the world's fastest-growing ad format in terms of ad spend, so it's really important that brands have their fingers on the pulse and allocate their marketing dollars wisely. Leaving it to luck simply isn't an option."

"Creating and distributing shareable content for social media is at the top of the agenda for CMOs, and brands can use the Lab experience to pinpoint exactly what's trending."

So, do social video recommendations significantly impact traditional brand metrics?

A recent study conducted by Decipher Research, which surveyed online video viewers, aged 18-34, across four social video campaigns from Guinness, Coca-Cola, Unilever's Cornetto, and Energizer Batteries, sought to determine the impact of peer recommendations. And the social ad effectiveness study found that recommendations dramatically increased ad performance.


Video Enjoyment

Viewers enjoy recommended videos more than non-recommended videos: there was a 14 percent increase in the number of people who enjoyed the video following a recommendation versus those who had discovered it by browsing. Moreover, a recommendation reduced the number of people who did not enjoy the video by 41 percent.

video-enjoyment-vs-social-video-discovery
Viewer enjoyment of branded video is important because it has a direct impact on key brand metrics. Viewers who enjoyed the video they watched demonstrated 139 percent higher brand association, 97 percent higher purchase intent, 35 percent higher brand favorability, and 14 percent higher brand recall than their counterparts who did not enjoy the video.

video-enjoyment-brand-metric

Brand Recall

Sixty-eight percent of viewers who had browsed to the video correctly recalled the brand when prompted, compared to 73 percent of viewers who had arrived at the video following a recommendation.

This 7 percent uplift suggests that video viewers are in a more receptive and attentive frame of mind following a recommendation, allowing brands that produce and distribute social content to benefit from closer communication with their audiences.

video-brand-recall-uplift

Brand Association

Recommendations caused a 7 percent increase in brand association: agreement with key brand statements increased from 41 percent among viewers who had browsed to the video to 44 percent among viewers who seen the video following a recommendation. This result reinforces the above suggestion that recommendations make viewers more receptive to brand messaging.
There was also a drop of more than one-fifth in the number of respondents that disagreed with key brand statements. Recommendations have a large role to play for brands in changing off-message perceptions amongst their audiences as well as in actively cultivating on-message perceptions.

key-brand-statements-increase

What Viewers Did Next

Viewers of the social videos tested went on to perform a multitude of brand or video related actions, notably 49 percent of viewers purchased the advertised product within three days of the view. Thirty-eight percent of viewers spoke to someone in person about the video, showing a social video view to stimulate real life conversation: what starts online becomes interchangeable with real life in the minds of today's consumers.

Interestingly, online sharing and emailing of the link are immediate reactions, highlighting the need for sharing functionality within a video player - users do not come back and share a video later, it is a spontaneous exercise. Nine percent of users searched for the brand, and 4 percent of users searched for products of that type: social video viewing is having an effect across all aspects of the purchase funnel.

user-behavior-within-3-days-of-video-viewing

Conclusion

This research demonstrates that social video significantly increases brand attention. The power of social video lies in the recommendation to view content. This recommendation comes not only from peers in social media environments, but also from authoritative blogs and news sources covering advertiser content editorially.

The impact of the recommendation on consumers is considerable:
  • Viewers are more likely to enjoy a video when it has been recommended than when encountered through browsing (14 percent higher enjoyment).
  • Viewers are more likely to recall a brand name when the social video has been recommended than when encountered through browsing (7 percent higher recall).
  • Viewers are more likely to engage with an ad's messages when the social has been recommended than when encountered through browsing (10 percent higher brand association).
Ultimately, enjoyment of the video correlated positively with all tested brand metrics in the sales funnel, including brand favorability and final purchase intent.-SearchEngineWatch

No time? No resources? Not sure where to start?
Call Jeff at 888-712-8211 today!  

VMakers - Video simplified.
Trusted by Disney, Warner Bros, NBC, Paramount, CBS and ABC.
info@VMakers.com